Visualizing trace profile data
To analyze the run-time behaviour of an application, a common technique is to record traces of code execution by inserting statements like these:
start_trace ("foo");
do_foo ();
end_trace ("foo");
This is an effective way to analyze concurrent applications that are usually
difficult to reason about. If the IDE1 does not support it, visualizing this
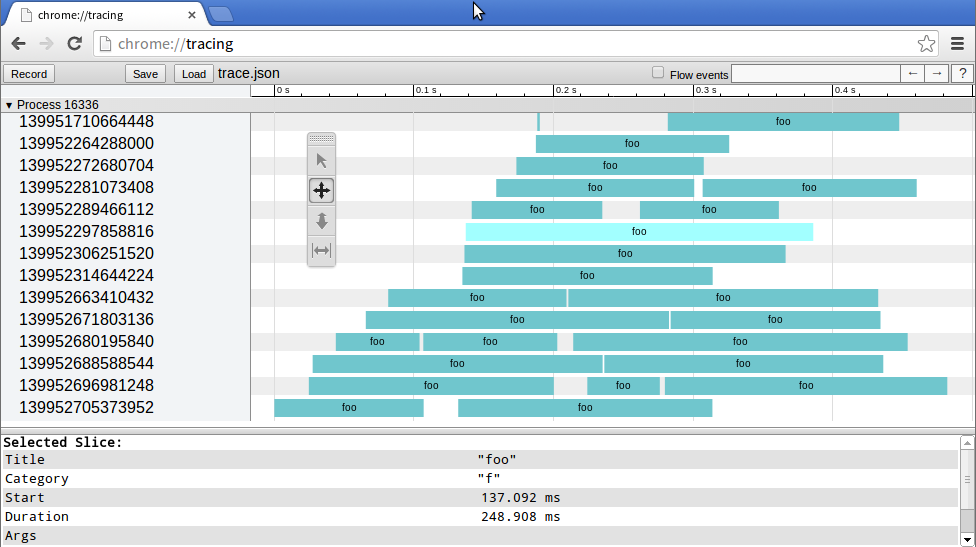
kind of data can be tricky. Fortunately, the Chrome browser exposes its internal
trace viewer via a generic [JSON format][] interface. All you have to do is
generate the appropriate data and load it in the about:tracing page:
Here is a very simple way how you could trace the execution of Python code without interspersing your code like stupid:
import os
import time
import threading
import functools
import json


class Manager(object):

    _START_CLOCK = time.time()

    def __init__(self):
        self._events = []
        self._pid = os.getpid()

    def _new_event(self, func, event):
        tid = threading.current_thread().ident
        timestamp = (time.time() - self._START_CLOCK) * 1000 * 1000
        self._events.append(dict(name=func.__name__,
                                 cat='f', ph=event,
                                 ts=timestamp,
                                 tid=tid, pid=self._pid))

    def trace(self, func):
        @functools.wraps(func)
        def record(*args, **kwargs):
            self._new_event(func, 'B')
            func(*args, **kwargs)
            self._new_event(func, 'E')

        return record

    def __del__(self):
      with open('trace.json', 'w') as fp:
          json.dump(dict(traceEvents=self._events), fp)
The Manager records all events for functions that are decorated with the
trace decorator, nothing fancy here. The distinction between the thread id
tid and the process id pid stems from the fact that Chrome has a
multi-process architecture, but you can of course use these fields in any way
you like. Just remember that events from the same thread id are layed out in the
same row and therefore need correctly ordered time stamps. Note that I also
didn’t took special care for the category field, i.e. just set it to “f”. In
the Managers destructor2 I just dump the events in the correct format.
The following test program demonstrates how to use the Manager and was used to
made the top image:
m = Manager()

@m.trace
def foo(t):
    print 'going to sleep for {} seconds'.format(t)
    time.sleep(t)

threads = []

for i in range(25):
    thread = threading.Thread(target=foo, args=(random.random() * 0.25,))
    thread.start()
    threads.append(thread)
    time.sleep(random.random() * 0.025)

for thread in threads:
    thread.join()
So, now stop wasting your time guessing the run-time behaviour of your application and measure it!
As far as I know, Eclipse has a mode to show thread execution. 2: This pattern is typically frowned upon by seasoned Python hackers but once in a while it can be of a good use. [JSON format]: https://docs.google.com/document/d/1CvAClvFfyA5R-PhYUmn5OOQtYMH4h6I0nSsKchNAySU/edit