Performance Impact of OpenCL Profiling
Profiling an OpenCL program is mandatory for optimizing the kernel performance.
Timers have the inevitable drawback, that you cannot measure asynchronous kernel
calls reliably without inserting synchronous calls such as clFinish() or
clFlush(). This is usually not a problem, you would just put these into your
code and guard them with #ifdef DEBUG/#endif. You would lose the possibility
to do overlapping computation but this would not affect release builds.
However, in some cases you might want to measure the performance of your kernels
in production runs and still ensure asynchronous kernel execution. In this case,
you have to query the profiling information associated with event objects using
clGetEventProfilingInfo() and make sure to enable profiling of command queues
with the CL_QUEUE_PROFILING_ENABLE property when calling
clCreateCommandQueue(). Usually, these kind of things incur a performance
overhead. Because I wanted to know how big this impact would be, I wrote a small
benchmark utility which measures the run time
for two small kernels and different input sizes. I ran this benchmark on my home
computer that sports a NVIDIA GTX 480 and a Core i5 3450.
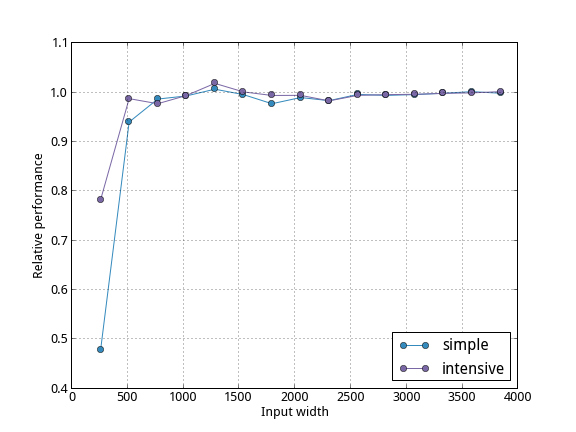
As you can see for very small input sizes (less than 512×512 pixels), could have a tremendous effect on the run-time. However, this also depends on the kind of operation you execute. The simple kernel was merely calculating
output[tid] = input[tid] * 2.0f;
whereas the more computationally demanding kernel computed
output[tid] = cos(input[tid]) * exp(input[tid] * 2.0f);
Of course, relatively less time is spent managing the event objects when a more complicated kernel is in place. This is even more so true, if you increase the number of computed elements. With more than 512×512 elements, the overhead becomes negligible and is sometimes even negative.
As a conclusion, you could do run-time evaluation for whatever reason, if your kernels are computationally demanding (which they are anyway, right?).